Profiler
Features
- Expose information about the current request
- Memory Usage / Profiling ...
Configuration
You need to enable the plugin by adding this line into the IoC configuration file.
element.plugins.profiler:
Also, you need to expose the profiler’s controllers
# profiler.yaml
title: Profiler
type: action.collection
actions:
    element_profiler_home:
        type: action.raw
        path: /<token>
        methods: ['GET']
        defaults:
            _controller: element.plugins.profiler.view:home

    element_profiler_view:
        type: action.raw
        path: /<token>
        methods: ['GET']
        defaults:
            _controller: element.plugins.profiler.view:view

    element_profiler_wdt:
        type: action.raw
        path: /wdt/<token>
        methods: ['GET']
        defaults:
            _controller: element.plugins.profiler.view:wdt

    element_profiler_pyinfo:
        type: action.raw
        path: /pyinfo
        methods: ['GET']
        defaults:
            _controller: element.plugins.profiler.view:pyinfo

    element_profiler_import:
        type: action.raw
        path: /import
        methods: ['GET']
        defaults:
            _controller: element.plugins.profiler.view:import_run

    element_profiler_export:
        type: action.raw
        path: /<token>/export
        methods: ['GET']
        defaults:
            _controller: element.plugins.profiler.view:export_run

    element_profiler_purge:
        type: action.raw
        path: /<token>/purge
        methods: ['GET']
        defaults:
            _controller: element.plugins.profiler.view:purge_run
Usage
The feature is enabled on dev mode, it does not work for threaded environment.
Preview
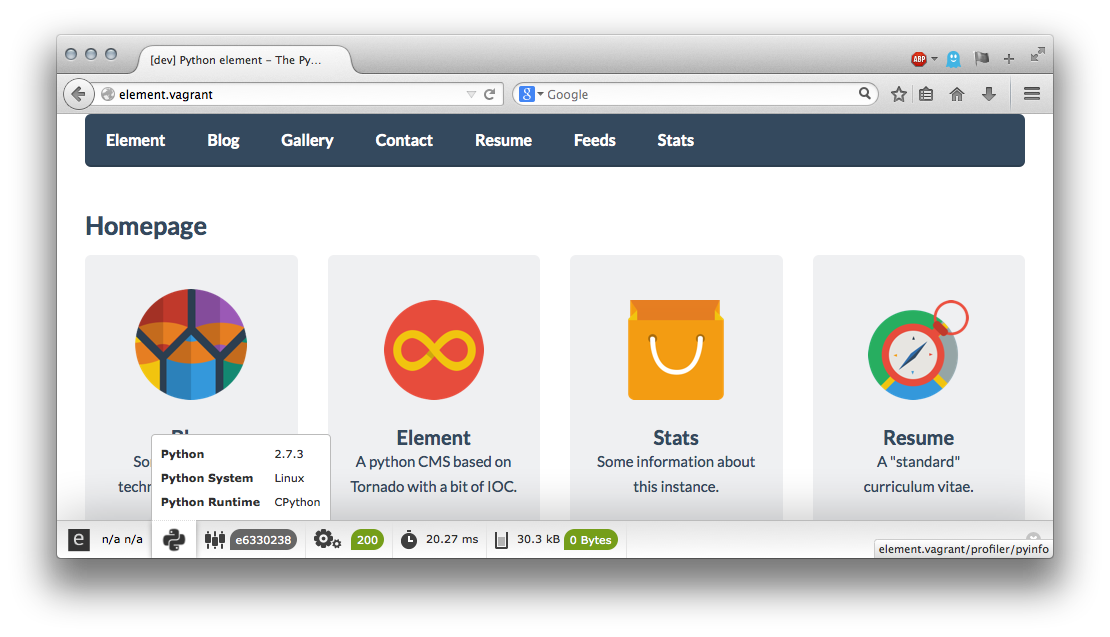
The wdt displays memory usage, processing time, controller and python version
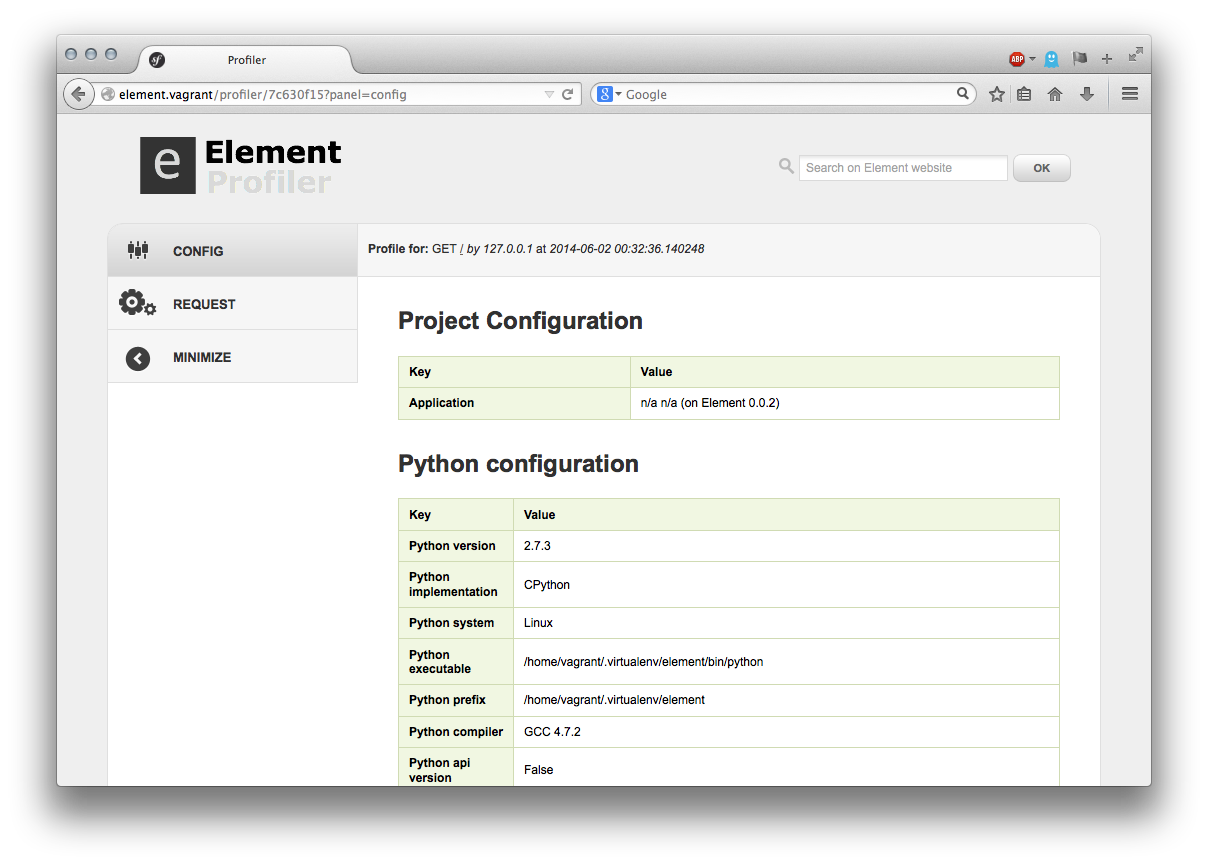
Display more detailed information profiling panel: config, request, etc ..
Credits
The WDT is a python port of the Symfony2 Profiler. Icons created by Sensio are shared under a Creative Commons Attribution license.